Top 20 Python ML Interview Questions and Answers (2026 Guide)
Machine Learning
Below are examples of some of the most commonly asked Python interview questions in machine learning interviews and data science interviews.
You should expect questions that test your fundamental knowledge of Python, data structures and algorithms, and how you use Python for
- data manipulation,
- data preprocessing,
- model evaluation,
- and feature engineering.
The specific format of questions depends on the company and the position you’re interviewing for.
For instance, Google MLE candidates report being asked to implement k-nearest neighbors, a broad and conceptual question. While Netflix interviews may focus more on model evaluation questions.
Data Preprocessing and Analysis
One application of your Python knowledge will be on data preprocessing and analysis problems.
Data preprocessing helps validate a dataset's quality and clean it before using statistical techniques to analyze it.
Sneak peek:
- Watch Meta MLE answer, "Design Instagram ranking model."
- Watch Amazon MLE answer, "Describe linear regression."
- Watch Snap MLE answer, "Implement k-means clustering."
Some sample questions include:
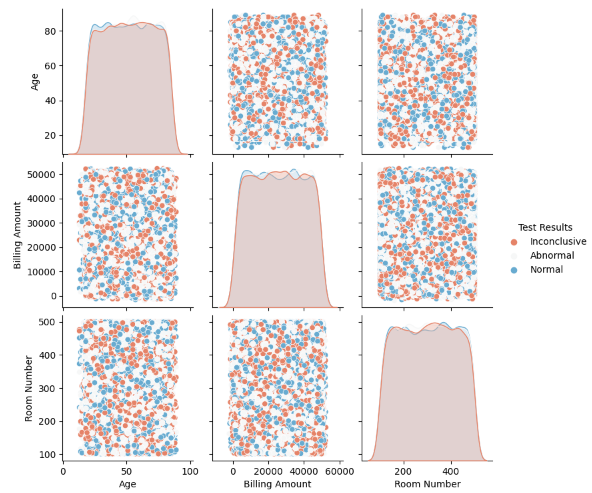
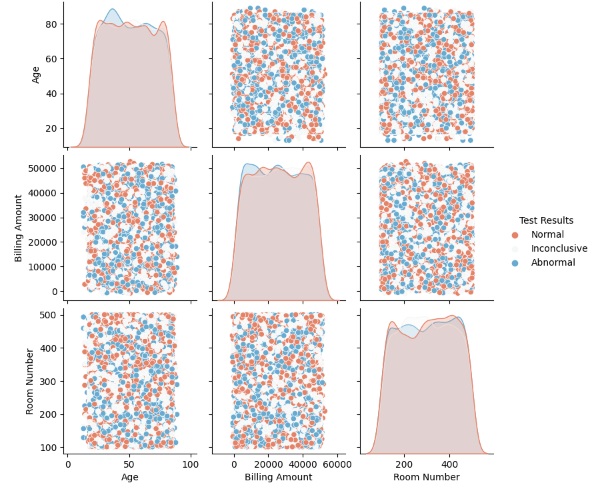
1. Split a dataset into training and test sets. Visualize their distributions to spot any discrepancies.
This question assesses your data preparation and analysis skills.
Discrepancies in training and test data distribution refer to differences in how data points are spread between two data subsets.
Here is a sample solution using pandas, sklearn, matplotlib, and seaborn:
import pandas as pd
from sklearn.model_selection import train_test_split
import matplotlib.pyplot as plt
import seaborn as sns

# Load the entire dataset from a CSV file
health_data = pd.read_csv('dataset.csv')

# Create train and test sets
trainingSet, testSet = train_test_split(health_data, test_size=0.2, random_state=123)

# Examine pairplots
plt.figure()
sns.pairplot(trainingSet, hue='Test Results', palette='RdBu')
plt.show()

plt.figure()
sns.pairplot(testSet, hue='Test Results', palette='RdBu')
plt.show()
Output:
2. Plot uni-variate and multivariate box-plots to detect outliers in selected columns of data.
Exploratory data analysis involves identifying outliers using boxplots.
You might also be asked to explain box-plots to a non-technical stakeholder.
Here's a sample solution using matplotlib and seaborn.
import matplotlib.pyplot as plt
import seaborn as sns

# Univariate and multivariate boxplots
fig, ax = plt.subplots(1, 2)
sns.boxplot(y=insurance_data['Annual Premium'], ax=ax[0])
ax[0].set_title('Univariate Boxplot of Annual Premium')
sns.boxplot(x='Vehicle Age', y='Annual Premium', data=insurance_data, ax=ax[1])
ax[1].set_title('Multivariate Boxplot of Vehicle Age vs. Annual Premium')
plt.show()
Output:
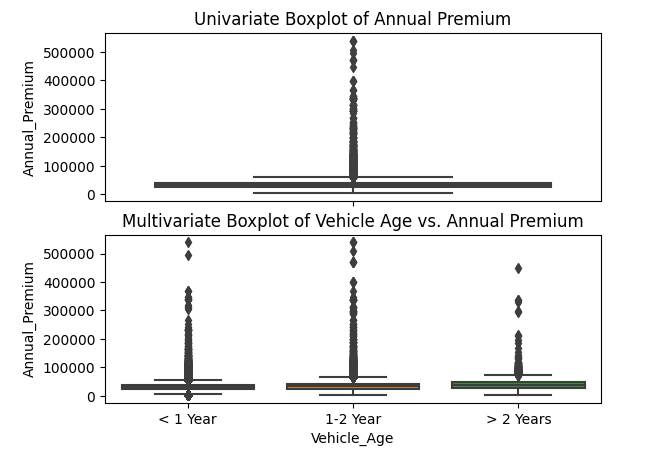
The horizontal line inside each box plot represents median values. The box represents the interquartile range (IQR).
Lines extending outside the box are called whiskers. They represent the range of data points that fall within 1.5 times the IQR from the quartiles (Q1 and Q3).
The annual premium distribution is positively skewed. This indicates that there are more expensive vehicles than cheaper ones. The IQR appears to be larger for 1-2-year-old vehicles, indicating a greater spread in premium costs within that age group.
3. Calculate z-scores and replace outliers.
Identifying and handling outliers in a dataset can be done using z-scores and interquartile ranges.
Here's a sample solution using pandas, numpy, and scipy:
import pandas as pd
import numpy as np
from scipy import stats

# Print columns before dropping
print(numeric_cols.mean())
print(numeric_cols.median())
print(numeric_cols.max())

# Create index of rows to keep
idx = (np.abs(stats.zscore(numeric_cols)) < 3).all(axis=1)

# Concatenate numeric and categorical subsets
ld_out_drop = pd.concat([numeric_cols.loc[idx], categoric_cols.loc[idx]], axis=1)

# Print columns after dropping
print(ld_out_drop.mean())
print(ld_out_drop.median())
print(ld_out_drop.max())- Calculate the z-scores using
stats.zscore(numeric_cols)for each value in the numeric columns. A z-score measures how many standard deviations a data point is from the mean. - Check if the absolute value of each z-score is less than 3 using
np.abs(...) < 3. A z-score less than 3 means the data point is within 3 standard deviations from the mean. This is a common threshold to identify outliers. .all(axis=1)ensures that all numeric columns for a given row must have z-scores less than 3 for the row to be kept.pd.concat([...], axis=1)concatenates the filtered numeric and categorical columns side by side.printstatistics after dropping outliers.
4. Calculate the count of all unique values of a categorical column in a DataFrame.
This question tests your understanding of foundational data analysis.
Here's a sample solution using pandas:
import pandas as pd

# Example DataFrame
data = {
    'Category': ['A', 'B', 'A', 'C', 'B', 'A', 'A', 'C', 'B']
}

df = pd.DataFrame(data)

# Calculate count of all unique values
unique_value_counts = df['Category'].value_counts()

print(unique_value_counts)
5. Implement min-max scaling on a NumPy array.
Min-max scaling preserves the original distribution of a dataset while ensuring all features have the same scale.
This is an essential part of the data preprocessing stage in machine learning projects and is usually calculated by:
- Subtracting the minimum value from each data point.
- Dividing the result of the previous step by the range of the dataset.
Here is a sample solution:
import numpy as np

def min_max_scaling(data):
    data_min, data_max = np.min(data), np.max(data)
    return (data - data_min) / (data_max - data_min)

data = np.array([5, 20, 50, 10, 15, 30])
scaled_data = min_max_scaling(data)
6. How do you perform feature scaling or normalization on a dataset in Python?
Feature scaling is a pre-processing technique that helps the model to converge faster by making the loss function more amenable to gradient descent.
Here's a sample solution using sklearn:
import numpy as np
import pandas as pd
from sklearn.preprocessing import StandardScaler, MinMaxScaler

# Sample dataset
data = {
    'Feature1': [10, 20, 30, 40, 50],
    'Feature2': [100, 150, 200, 250, 300],
    'Feature3': [1000, 1100, 1200, 1300, 1400]
}

df = pd.DataFrame(data)

# Standardization
scaler = StandardScaler()
scaled_data = scaler.fit_transform(df)

# Convert scaled data back to DataFrame
scaled_df = pd.DataFrame(scaled_data, columns=df.columns)
print("Standardized Data:\n", scaled_df)

# Normalization
scaler = MinMaxScaler()
normalized_data = scaler.fit_transform(df)

# Convert normalized data back to DataFrame
normalized_df = pd.DataFrame(normalized_data, columns=df.columns)
print("Normalized Data:\n", normalized_df)
7. Calculate percentiles with NumPy.
This question requires you to use statistical methods to analyze and interpret data.
Here's a sample solution:
import numpy as np

# Example dataset
data = np.array([1, 2, 3, 4, 5, 6, 7, 8, 9, 10])

# Calculate the 25th, 50th (median), and 75th percentiles
percentiles = np.percentile(data, [25, 50, 75])

print("25th percentile:", percentiles[0])
print("50th percentile (median):", percentiles[1])
print("75th percentile:", percentiles[2])
Python Fundamentals and Programming
You should be familiar with the fundamentals of the Python language, as well as how to use it to solve common coding problems for all interview levels.
One of the most popular programming languages for interviews is Python.
Here are some examples:
8. Compute the Euclidean distance between two points.
Euclidean distance is often used to measure the similarity between two points in clustering algorithms, dimensionality reduction, and nearest neighbor search.
Your ability to implement mathematical concepts in Python is being assessed with this question.
Here's a sample solution using numpy:
import numpy as np

def euclidean_distance(point_a, point_b):
    return np.sqrt(np.sum((point_a - point_b) ** 2))

point_a = np.array([1, 2, 3])
point_b = np.array([4, 5, 6])
distance = euclidean_distance(point_a, point_b)
print(distance)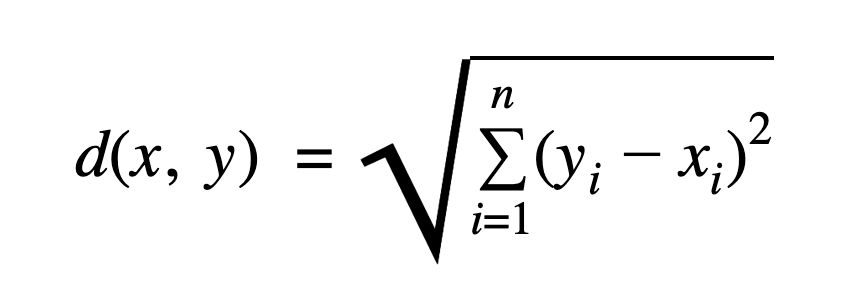
9. Replace string spaces with a given character.
This is a fundamental problem-solving and programming problem.
Here's a sample solution:
def replace_spaces_with_hyphen(text):
    # Replace spaces with hyphen
    return text.replace(' ', '-')

# Original text
text = "Exponent machine learning course"

# Replace spaces with hyphen
modified_text = replace_spaces_with_hyphen(text)
print(modified_text)  # Output: "Exponent-machine-learning-course"
10. Implement K-means clustering from scratch.
import numpy as np

class Centroid:
    def __init__(self, location, vectors):
        self.location = location  # (D,)
        self.vectors = vectors    # (N_i, D)

class KMeans:
    def __init__(self, n_features, k):
        self.n_features = n_features
        self.centroids = [
            Centroid(
                location=np.random.randn(n_features),
                vectors=np.empty((0, n_features))
            )
            for _ in range(k)
        ]

    def distance(self, x, y):
        return np.sqrt(np.dot(x - y, x - y))

    def fit(self, X, n_iterations):
        for _ in range(n_iterations):
            # Reset centroid vectors
            for centroid in self.centroids:
                centroid.vectors = np.empty((0, self.n_features))

            # Assign points to the nearest centroid
            for x_i in X:
                distances = [
                    self.distance(x_i, centroid.location) for centroid in self.centroids
                ]

                min_idx = distances.index(min(distances))
                cur_vectors = self.centroids[min_idx].vectors

                self.centroids[min_idx].vectors = np.vstack((cur_vectors, x_i))

            # Update centroid locations
            for centroid in self.centroids:
                if centroid.vectors.size > 0:
                    centroid.location = np.mean(centroid.vectors, axis=0)

    def predict(self, x):
        distances = [self.distance(x, centroid.location) for centroid in self.centroids]
        return distances.index(min(distances))
11. What are the two ways to create a pandas DataFrame?
Creating a DataFrame is a fundamental skill in data manipulation and analysis.
Here's a sample solution using pandas:
import pandas as pd

# Method one
data = {
    'Name': ['Alice', 'Bob', 'Charlie'],
    'Age': [25, 30, 35],
    'City': ['New York', 'Los Angeles', 'Chicago']
}

df = pd.DataFrame(data)
print(df)

# Method two

data = [
    ('Alice', 25, 'New York'),
    ('Bob', 30, 'Los Angeles'),
    ('Charlie', 35, 'Chicago')
]

df = pd.DataFrame(data, columns=['Name', 'Age', 'City'])
print(df)
Machine Learning and Model Evaluation
A large part of your role as a machine learning engineer is deploying and evaluating models.
Real-world deployments of ML models often run into various challenges that require more than just accuracy-based metrics.
Here are some sample questions you should practice:
12. Create a model using KNeighborsClassifier. Interpret feature relationships.
This algorithm uses distance metrics like Euclidean distance to compute the similarity between data points.
Here's a sample implementation:
import numpy as np
from sklearn.neighbors import KNeighborsClassifier

# Create neighbors
neighbors = np.arange(1, 13)
train_accuracies = {}
test_accuracies = {}

for neighbor in neighbors:
    # Set up a KNN Classifier
    knn = KNeighborsClassifier(n_neighbors=neighbor)

    # Fit the model
    knn.fit(X_train, y_train)

    # Compute accuracy
    train_accuracies[neighbor] = knn.score(X_train, y_train)
    test_accuracies[neighbor] = knn.score(X_test, y_test)
print(neighbors, '\\n', train_accuracies, '\\n', test_accuracies)
13. Build a K-nearest neighbors classification model from scratch.
KNN is a common supervised machine learning algorithm.
Designing it from scratch gives insights into your proficiency in using NumPy for mathematical operations.
Here's a sample numpy solution:
import numpy as np
class KNNClassifier:
def __init__(self, k=3):
self.k = k
def fit(self, X_train, y_train):
self.X_train = X_train
self.y_train = y_train
def predict(self, X_test):
predictions = []
for x in X_test:
# Calculate distances from x to all examples in X_train
distances = [np.sqrt(np.sum((x - x_train)**2)) for x_train in self.X_train]
# Get indices of k nearest samples
k_indices = np.argsort(distances)[:self.k]
# Get the labels of the k nearest neighbor training samples
k_nearest_labels = [self.y_train[i] for i in k_indices]
# Predict the label of x by majority voting
most_common = np.bincount(k_nearest_labels).argmax()
predictions.append(most_common)
return np.array(predictions)
# Sample data
X_train = np.array([[1, 2], [1.5, 1.8], [5, 8], [8, 8], [1, 0.6], [9, 11]])
y_train = np.array([0, 0, 1, 1, 0, 1])
X_test = np.array([[1, 3], [8, 9], [0, 3], [5, 4]])
# Initialize and train the model
model = KNNClassifier(k=3)
model.fit(X_train, y_train)
# Predict
predictions = model.predict(X_test)
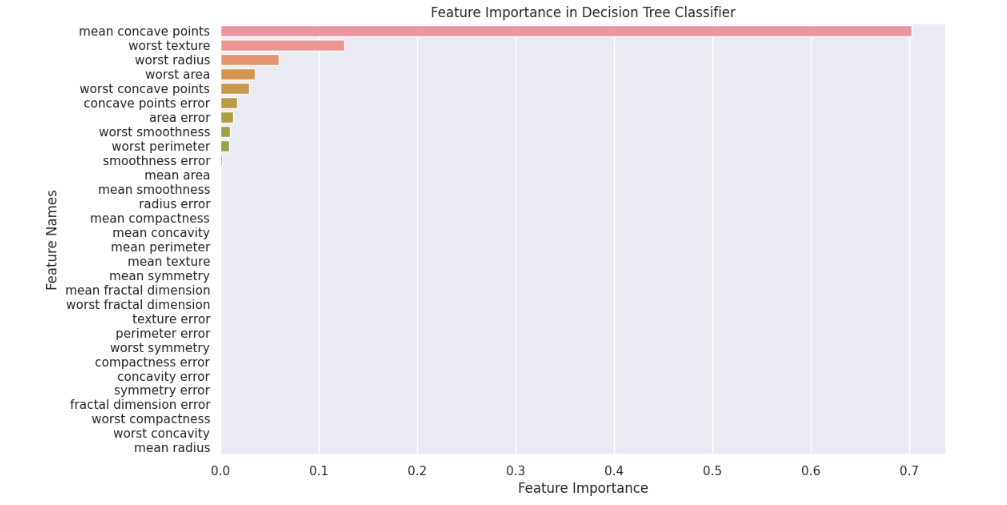
print("Predictions:", predictions)14. Estimate and visualize feature importance in a given dataset.
Feature importance dictates the role a feature variable plays in describing the target variable.
Here's a sample solution:
import pandas as pd
import seaborn as sns
import matplotlib.pyplot as plt
from sklearn import datasets
from sklearn.model_selection import train_test_split
from sklearn.tree import DecisionTreeClassifier

# Load the dataset
dataset = datasets.load_breast_cancer()
X = pd.DataFrame(dataset.data, columns=dataset.feature_names)
y = dataset.target

# Split the dataset into training and testing sets
X_train, X_test, y_train, y_test = train_test_split(X, y, test_size=0.25, random_state=42)

# Initialize the Decision Tree Classifier
clf = DecisionTreeClassifier(criterion='gini')

# Fit the classifier
clf.fit(X_train, y_train)

# Get the feature importances
feature_importances = clf.feature_importances_

# Sort the feature importances in descending order
sorted_indices = feature_importances.argsort()[::-1]
sorted_feature_names = X.columns[sorted_indices]
sorted_importances = feature_importances[sorted_indices]

# Create a bar plot of the feature importances
sns.set(rc={'figure.figsize':(11.7, 7)})
sns.barplot(x=sorted_importances, y=sorted_feature_names)
plt.xlabel('Feature Importance')
plt.ylabel('Feature Names')
plt.title('Feature Importance in Decision Tree Classifier')
plt.show()
Here's a sample output:
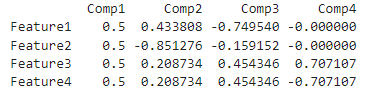
15. Compute Principal Component Analysis (PCA) and pick principal components.
Here, you’re being assessed on your ability to combat the curse of dimensionality using PCA.
For example:
from sklearn.decomposition import PCA

penguins_pca = PCA(n_components=4)
components = penguins_pca.fit(penguins).components_
components = pd.DataFrame(components).transpose()
components.columns = ['Comp1', 'Comp2', 'Comp3', 'Comp4']
components.index = penguins.columns
print(components)
Sample output:
16. Implement hyperparameter tuning using RandomizedSearchCV.
RandomizedSearchCV randomly samples hyperparameter combinations from the specified distributions.
It uses cross-validation to evaluate the performance of each set of hyperparameters.
Here's a sample solution:
import numpy as np
import pandas as pd
from sklearn.datasets import load_iris
from sklearn.model_selection import train_test_split, RandomizedSearchCV
from sklearn.ensemble import RandomForestClassifier
from sklearn.metrics import accuracy_score

# Load and preprocess the data
data = load_iris()
X = data.data
y = data.target
X_train, X_test, y_train, y_test = train_test_split(X, y, test_size=0.2, random_state=42)

# Define the model
model = RandomForestClassifier()

# Define the parameter grid
param_dist = {
    'n_estimators': np.arange(10, 200, 10),
    'max_features': ['auto', 'sqrt', 'log2'],
    'max_depth': np.arange(1, 20, 1),
    'criterion': ['gini', 'entropy']
}

# Perform Randomized Search
random_search = RandomizedSearchCV(model, param_distributions=param_dist, n_iter=100, cv=5, random_state=42, n_jobs=-1)
random_search.fit(X_train, y_train)

# Get the best model
best_model = random_search.best_estimator_
print("Best Parameters:", random_search.best_params_)

# Evaluate the best model
y_pred = best_model.predict(X_test)
accuracy = accuracy_score(y_test, y_pred)
print("Test Accuracy:", accuracy)
17. Split a dataset into training, test, and validation sets.
To answer this question requires determining how much data to allocate to training, testing, and validation, considering the overall dataset size.
Here's a sample solution using sklearn:
from sklearn.model_selection import train_test_split

# X = your features (data)
# y = your target labels

# Splitting with a dedicated evaluation (validation) set
X_train, X_test_val, y_train, y_test_val = train_test_split(X, y, test_size=0.2, random_state=42)

# Further split the test/validation set into testing and validation (optional)
X_test, X_val, y_test, y_val = train_test_split(X_test_val, y_test_val, test_size=0.5, random_state=42)
Advanced Techniques and Deep Learning
18. Implement a basic Convolutional Neural Network (CNN) architecture.
This task evaluates your proficiency in deep learning frameworks.
Sample solution using tensorflow:
import tensorflow as tf
from tensorflow.keras import layers, models
from tensorflow.keras.datasets import mnist
from tensorflow.keras.utils import to_categorical

# Load and preprocess the data
(X_train, y_train), (X_test, y_test) = mnist.load_data()
X_train = X_train.reshape((X_train.shape[0], 28, 28, 1)).astype('float32') / 255
X_test = X_test.reshape((X_test.shape[0], 28, 28, 1)).astype('float32') / 255
y_train = to_categorical(y_train)
y_test = to_categorical(y_test)

# Define the CNN model
model = models.Sequential()
model.add(layers.Conv2D(32, (3, 3), activation='relu', input_shape=(28, 28, 1)))
model.add(layers.Max

Pooling2D((2, 2)))
model.add(layers.Conv2D(64, (3, 3), activation='relu'))
model.add(layers.MaxPooling2D((2, 2)))
model.add(layers.Conv2D(64, (3, 3), activation='relu'))
model.add(layers.Flatten())
model.add(layers.Dense(64, activation='relu'))
model.add(layers.Dense(10, activation='softmax'))

# Compile the model
model.compile(optimizer='adam',
              loss='categorical_crossentropy',
              metrics=['accuracy'])

# Train the model
model.fit(X_train, y_train, epochs=5, batch_size=64, validation_split=0.1)

# Evaluate the model
test_loss, test_acc = model.evaluate(X_test, y_test)
print("Test accuracy:", test_acc)
19. Implement batch normalization.
Implementing batch normalization is essential for deep learning tasks.
Here's a numpy solution:
import numpy as np

class BatchNormalization:
    def __init__(self, epsilon=1e-5, momentum=0.9):
        self.epsilon = epsilon
        self.momentum = momentum
        self.running_mean = None
        self.running_var = None

    def forward(self, X, gamma, beta, training=True):
        if self.running_mean is None:
            self.running_mean = np.mean(X, axis=0)
            self.running_var = np.var(X, axis=0)

        if training:
            batch_mean = np.mean(X, axis=0)
            batch_var = np.var(X, axis=0)

            self.running_mean = self.momentum * self.running_mean + (1 - self.momentum) * batch_mean
            self.running_var = self.momentum * self.running_var + (1 - self.momentum) * batch_var

            X_norm = (X - batch_mean) / np.sqrt(batch_var + self.epsilon)
        else:
            X_norm = (X - self.running_mean) / np.sqrt(self.running_var + self.epsilon)

        out = gamma * X_norm + beta
        cache = (X, X_norm, batch_mean, batch_var, gamma, beta, self.epsilon)

        return out, cache

    def backward(self, dout, cache):
        X, X_norm, batch_mean, batch_var, gamma, beta, epsilon = cache
        N, D = X.shape

        X_mu = X - batch_mean
        std_inv = 1. / np.sqrt(batch_var + epsilon)

        dX_norm = dout * gamma
        dvar = np.sum(dX_norm * X_mu, axis=0) * -.5 * std_inv**3
        dmean = np.sum(dX_norm * -std_inv, axis=0) + dvar * np.mean(-2. * X_mu, axis=0)

        dX = (dX_norm * std_inv) + (dvar * 2 * X_mu / N) + (dmean / N)
        dgamma = np.sum(dout * X_norm, axis=0)
        dbeta = np.sum(dout, axis=0)

        return dX, dgamma, dbeta

# Example usage
np.random.seed(0)
X = np.random.randn(5, 4)
gamma = np.ones((4,))
beta = np.zeros((4,))

bn = BatchNormalization()
out, cache = bn.forward(X, gamma, beta, training=True)
print("Forward pass output:\n", out)

dout = np.random.randn(*out.shape)
dX, dgamma, dbeta = bn.backward(dout, cache)
print("\nBackward pass gradients:\ndX:\n", dX, "\ndgamma:\n", dgamma, "\ndbeta:\n", dbeta)
20. Implement linear regression.
This question demonstrates multiple skills, including problem-solving, mathematical knowledge of linear regression, and how to implement it.
Here's a simple implementation of linear regression from scratch :
import numpy as np
import matplotlib.pyplot as plt
from sklearn.datasets import make_regression

class LinearRegressionScratch:
    def __init__(self):
        self.coefficients = None

    def fit(self, X, y):
        X_b = np.c_[np.ones((X.shape[0], 1)), X]  # Add bias term to feature matrix
        self.coefficients = np.linalg.inv(X_b.T.dot(X_b)).dot(X_b.T).dot(y)

    def predict(self, X):
        X_b = np.c_[np.ones((X.shape[0], 1)), X]  # Add bias term to feature matrix
        return X_b.dot(self.coefficients)

# Create a simple regression dataset with one feature
X, y = make_regression(n_samples=100, n_features=1, noise=15, random_state=42)

# Create and fit the model
model = LinearRegressionScratch()
model.fit(X, y)

# Predicting the outputs
y_pred = model.predict(X)

# Plot the data points
plt.scatter(X, y, color="blue", label="Data Points")

# Plot the regression line
plt.plot(X, y_pred, color="red", label="Regression Line")

# Add labels and legend
plt.xlabel('Feature')
plt.ylabel('Target')
plt.title('Linear Regression from Scratch')
plt.legend()

# Show the plot
plt.show()
Preparing for Python Machine Learning Questions
Preparing for Python machine learning interviews requires a deep understanding of Python concepts and machine learning principles, as well as strong communication skills to discuss your thought process effectively. A few tips that speed up the preparation are:
- Research the company to set expectations before you appear in the interview.
- Schedule a free mock interview session to practice answering questions with other peers.
- Take a Machine Learning interview prep course to study the most common interview questions featuring top tech companies and startups.
Python Machine Learning Interview Tips
The following tips will help you to effectively answer all coding questions in your upcoming interview:
- Take time to understand the problem, ask clarifying questions, try a few toy examples, and ensure you understand the inputs and outputs.
- Write a high-level outline of your algorithm in pseudo-code and discuss it with the interviewer.
- Select your preferred language and frameworks you’re most proficient in and comfortable with beforehand. Implement the algorithm and explain it out loud as you write the code.
- Test your code before moving to the next problem, discuss the results, and note any significant takeaways.
Book time with a Machine Learning Engineer coach
- Mock interviews
- Career coaching
- Resume review
Learn everything you need to ace your machine learning interviews.
Exponent is the fastest-growing tech interview prep platform. Get free interview guides, insider tips, and courses.
Create your free accountRelated Courses

Machine Learning Engineer Interview Prep Course

Related Blog Posts
Top ML Interview Questions (2026 Guide)
Machine Learning System Design Interview (2026 Guide)

Complete Guide to Machine Learning Engineering Interviews